What a Gantt chart is and who uses one
A Gantt chart is a horizontal bar chart that lays a project out on a timeline. Each row is a task. The bar shows when that task runs. You can see at a glance which tasks overlap, which depend on others finishing first, and whether the project is running to schedule.
They are used across every kind of project: website builds, product launches, office moves, construction jobs, event planning. Any piece of work with a sequence of tasks and a deadline benefits from one.
For a UK freelancer or contractor working on a client project, a Gantt chart is often the clearest way to agree a plan upfront and then track delivery against it. It sets expectations on both sides.
How this template is laid out
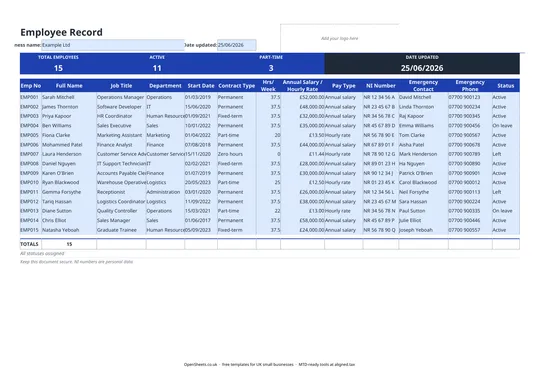
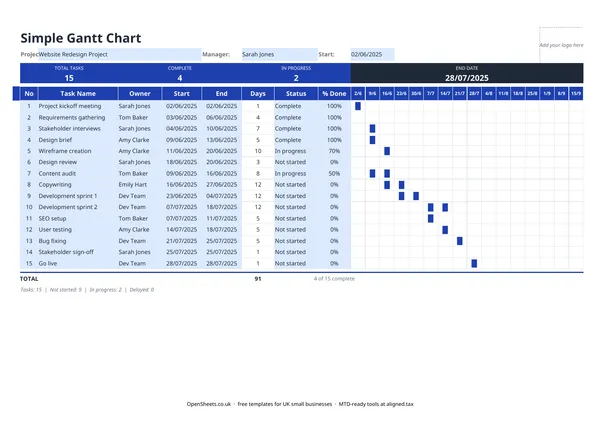
The template has a summary row across the top showing your total task count, how many are complete, and how many are in progress. Below that, each task gets its own row.
The columns on the left side capture the essentials: task number, task name, the person responsible, the start date, the end date, the duration in days, the status, and a percentage done figure. On the right, the weekly columns run across the sheet. As you enter start and end dates, the bars fill in automatically to show the task on the timeline.
The project name, manager name, and start date sit in the header. Change the start date and the week columns shift to match, so you can reuse the template for any project without reformatting.
Setting it up for a real project
The fastest way is to list all your tasks first, without worrying about order or dates. Get everything on paper (or in the sheet) and then go back and add the dates and owners.
Once the dates are in, look for conflicts. Tasks that overlap for the same owner can mean someone is double-booked. Tasks that run sequentially but have a gap between them might indicate a milestone you have forgotten, or just a realistic buffer.
The % Done column is worth updating regularly. A task that is 90% done and has been 90% done for two weeks is a warning sign. Keeping the percentage honest makes the summary row useful rather than optimistic.
Common mistakes when running projects this way
Starting the plan after the project has started. A Gantt chart is most useful before work begins. Built after the fact, it is just a record. Built at the start, it is a communication tool and a contract with your team.
Too many tasks, not enough detail in the right places. Breaking a project into 50 micro-tasks makes the chart unreadable. Group related work into phases and break down only the stages where timing really matters.
Not updating it. A Gantt chart you look at once at kickoff and never touch again tells you nothing by week four. A few minutes each week keeping the status and percentage columns current means the summary row stays useful.
Forgetting dependencies. If Task 6 cannot start until Task 4 is done, that is worth knowing before Task 4 runs late. The template does not draw dependency arrows automatically, but you can note dependencies in the task name or use the status to see what is blocking.
Keeping records and MTD
A Gantt chart is a project-planning tool, not a financial document. HMRC does not ask to see it.
That said, if your combined income from self-employment and property is over £50,000, Making Tax Digital for Income Tax already applies to you from April 2026. It means keeping digital records of your income and expenses and sending HMRC a quarterly update, rather than only filing once a year. The thresholds drop to £30,000 from April 2027 and £20,000 from April 2028.
If project-based work is part of your self-employed income, keeping your invoices and expenses in order alongside your project plans is good practice. When you are ready to send your quarterly updates, Aligned (aligned.tax) is free MTD bridging software that connects your existing spreadsheet to HMRC. Worth a look when the time comes.